新SAT语法备考:图表题该如何应对?
问题相似?试试立即获取解答吧~
摘要:新SAT在语法部分的变化还是非常显著的:新SAT语法题以篇章的形式出现。旨在考查考生对篇章阅读的理解,尤其是对文章逻辑性和连贯性的把握,这无疑对考生提出了更高的语言能力要求。本篇文章将为大家着重讲解新STA语法部分新增图表题的答题注意事项。

新SAT考试阅读部分和语法部分都加入了新的题型——图表题。语法部分的图表题要求考生通过分析和概括图表中的数据来选出正确选项,并且还要兼顾此选项在语法上的正确性。很多考生听到这些心里可能就担心了,觉得好难。其实图表题只是形式新颖,题目并不算难,考生只需认真看图,注意图表注解,关注图表中的趋势变化和极值分布就很容易解题了。不信的话来看以下这道题:
Most of Greenland’s interior is covered by a thick layer of ice and compressed snow known as the Greenland Ice Sheet. The size of the ice sheet fluctuates seasonally: in summer, average daily high temperatures in Greenland can rise to slightly above 50 degrees Fahrenheit, partially melting the ice; in the winter, the sheet thickens as additional snow falls, and average daily low temperatures can drop to as low as 20 degrees.
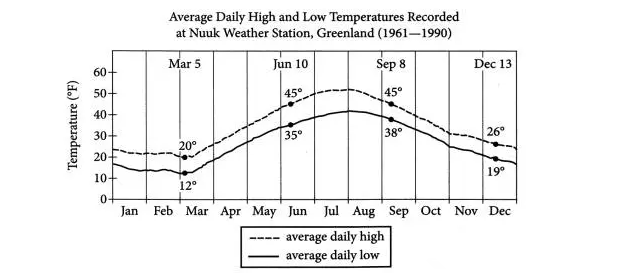
Which choice most accurately and effectively represents the information in the graph?
A) NO CHANGE
B) to 12 degrees Fahrenheit.
C) to their lowest point on December 13.
D) to 10 degrees Fahrenheit and stay there for months.
看图表时考生需要注意图表的标题,横轴纵轴所代表的信息,图表纵轴表示温度,横轴表示月份,温度最低出现在Mar.5, 12°, 因此选B项。
所以,通过以上例题的讲解考生们有一点要非常明确:细节决定成败。图表的题目、横坐标、纵坐标都是很重要的图表组成部分,这些内容直接影响你的答题正确与否。其实这道题也没有考很难的语法知识点,就是要求考生能够读懂图表,回答问题。
 沪公网安备
31010602002658号
沪公网安备
31010602002658号

每日提分任务
专业提分资料
全程督学答疑