【新SAT阅读】图表题类真题类型及解题思路分析
问题相似?试试立即获取解答吧~
摘要:新SAT的阅读版块增加了全新的题型—循证题和图表题,本篇文章详细解读一下图表题真题设置的意义、真题分类以及图表题的真题实例分析,希望对大家备考新SAT阅读考试有帮助。
2. 数据推理类
例题:Test 2 Question 19(同上题图表)
Data in the graph about per-pound coffee profits in Tanzania most strongly support which of the following statements?
A) Fair trade coffee consistently earned greater profits than regular coffee earned.
B) The profits earned from regular coffee did not fluctuate.
C) Fair trade coffee profits increased between 2004 and 2006.
D) Fair trade and regular coffee were earning equal profits by 2008.
解析:题目问根据图表的咖啡每磅收益的信息能得出以下哪个结论。此时需要逐一看每个选项并对照图表看是否正确。A选项说fair trade coffee收益一直高于regular coffee,对照图表,代表fair trade coffee的虚线一直在代表regular coffee的黑线上方,所以A选项正确。B选项regular coffee的数据没有波动,而图表中代表regular coffee的黑线有起伏。C选项fair trade coffee在2004-2006年内利润增加,但图表中数据没变化,所以不对。D选项2008年两种咖啡收益相同,而图表中fair trade coffee大约130;regular coffee大约60,所以不同,D选项不正确。
3. 结合文章类
例题 Test 3 Question 52
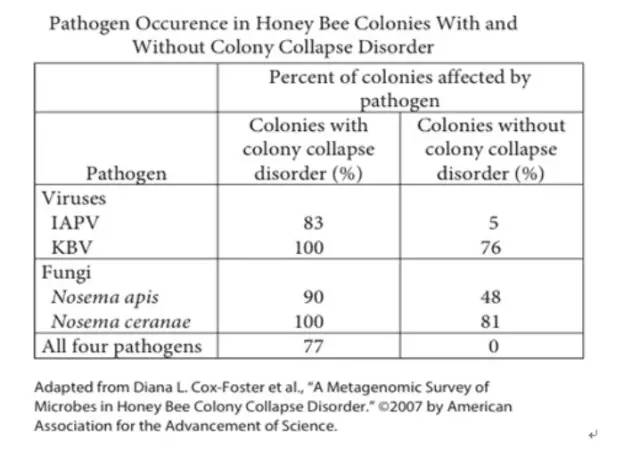
52. Do the data in the table provide support for the authors’ claim that infection with varroa mites increases a honeybee’s susceptibility to secondary infections?
A) Yes, because the data provide evidence that infection with a pathogen caused the colonies to undergo colony collapse disorder.
B) Yes, because for each pathogen, the percent of colonies infected is greater for colonies with colony collapse disorder than for colonies without colony collapse disorder.
C) No, because the data do not provide evidence about bacteria as a cause of colony collapse disorder.
D) No, because the data do not indicate whether the honeybees had been infected with mites.
解析:先理解题干,问的是数据中的信息是否支持文中作者的观点:感染了varroa mites的增加了蜜蜂2次感染的可能性。而观察图表中的内容并没有与感染varroa mites有关,也没有与二次感染相关的内容,所以A和B不对。而C选项与题干无关,所以错误。D为正确选项。
做完以上题目,结合官方指南上的样题,我们来归纳了如下的解题思路。
图表题解题思路:
1. 定位信息类
a. 关注题干,明确考查信息的范围
b. 根据题干信息定位图表数据,缩小范围,找到数据
c. 对应选项,确定正确答案
2. 数据推理类
a. 关注题干,明确考查信息的范围
b. 根据题干信息定位图表数据,比较数据
c. 逐一核对选项,与图表对应,排除错误,选最佳
3. 结合文章类
a. 关注题干
b. 根据题干信息分析图表,比较数据
c. 回到原文定位与图表内容相关信息,将文章与图表信息对应
d. 逐一核对选项,与图表对应,排除错误选最佳
以上就是小编为大家讲解的新SAT阅读图表题的解题技巧,在了解题目特点及解题思路之后,各位考生应结合官方指南踏实练习,备战新SAT考试的到来。
 沪公网安备
31010602002658号
沪公网安备
31010602002658号
每日提分任务
专业提分资料
全程督学答疑