雅思写作Task1小作文线性图范文--澳洲青少年消耗的快餐数
问题相似?试试立即获取解答吧~
摘要:小站雅思频道这里和大家分享小作文线性图的一篇范文,关于澳洲青少年消耗的快餐数,真题是:The amount and type of fast food consumed by Australian teenagers from 1975 to 2000.来看关于这个task的解析和范文!
Task:The amount and type of fast food consumed by Australian teenagers from 1975 to 2000.
思路解析:
1. 分段原则:按照线段的形状分类,上升的一段,下降的一段。
2. 折线模式的重点在于描述数据的改变和趋势。
3. 注意线段描述的完整性:动作+幅度。
4. 注意一类数据的描述(Max, Min, 交点等)。
参考范文:
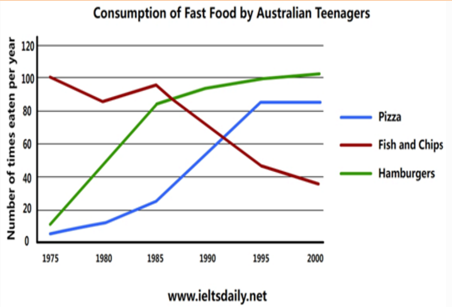
The line graph illustrates the amount of fast food consumed by teenagers in Australia between 1975 and 2000, a period of 25 years. Overall, the consumption of fish and chips declined over the period, whereas the amount of pizza and hamburgers that were eaten increased.
In 1975, the most popular fast food with Australian teenagers was fish and chips, being eaten 100 times a year. This was far higher than Pizza and hamburgers, which were consumed approximately 5 times a year. However, apart from a brief rise again from 1980 to 1985, the consumption of fish and chips gradually declined over the 25 year timescale to finish at just under 40 times per year.
In sharp contrast to this, teenagers ate the other two fast foods at much higher levels. Pizza consumption increased gradually until it overtook the consumption of fish and chips in 1990. It then leveled off from 1995 to 2000. The biggest rise was seen in hamburgers, increasing sharply throughout the 1970’s and 1980’s, exceeding fish and chips consumption in 1985. It finished at the same level that fish and chips began, with consumption at 100 times a year.
(196 words)


 沪公网安备
31010602002658号
沪公网安备
31010602002658号