
【小站出品】2016年8月13日雅思考试小作文范文
问题相似?试试立即获取解答吧~
摘要:分享小站老师写的8月13日雅思写作的小作文参考范文。本次小作文考的是一道折线图:The graph and table below show the percentage of population in the world from 1950s to projections in 2040.来看范文!
Task:The graph and table below show the percentage of population in the world from 1950s to projections in 2040.

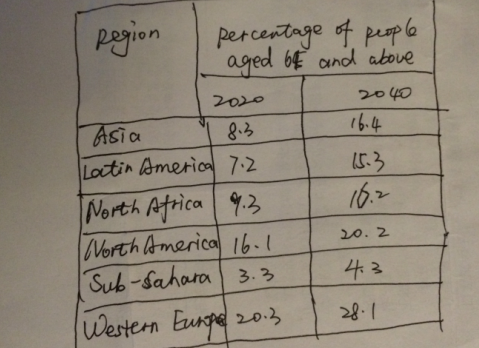
The table shows the percentage of people aged 65 and above in different regions.
参考范文:
The two types of graphs uncover the aging trends globally and regionally.
The line graph reveals the global proportions of seniors and children from 1950 to predictions in 2040. Since 1950, the figure for seniors, starting at 5%, increased gradually while that for children, beginning at 13%, decreased after an initial rise, and the two lines intersect at 8% in 2016. From 2020 to 2040, it is projected that the elderly will continue to grow more dramatically at 15% while the toddlers will drop to 7%.
The table demonstrates the predicated percentage of the elderly at 65 and above in 2020 and 2040 in six areas. For Asia, Latin America, and North Africa, all of them will experience a double increase in the aged from around 7.3% to about 16% during the period in question. By contrast, North America, Sub-Sahara and Western Europe are expected to have a slower increase in the elders.
In conclusion, though most pressing in Western Europe and North America, the intensification of the aging phenomenon has already become a global issue.
(176 words)
版权申明:小站教育原创,转载须以超链接形式标注本文出处,并附上此申明,否则将承担一切法律后果。


 沪公网安备
31010602002658号
沪公网安备
31010602002658号


