
雅思写作Task1小作文柱状图范文--人口规律和未来趋势
问题相似?试试立即获取解答吧~
摘要:小站雅思频道这里和大家分享小作文柱状图的一篇范文,关于人口规律和未来趋势,真题是:The two graphs show the main sources of energy in the USA in the 1980s and the 1990s.
Task:The chart below shows the percentage of population in India, China, the USA and Japan in 1950 and 2002.
思路解析:
【首段】转述题目+补充信息
【二段】中国的人口规律和未来趋势
【三段】印度的
【四段】美国和韩国的
【尾段】总结,重申全图最主要趋势,印度将取代中国成人口第一大国.
参考范文:
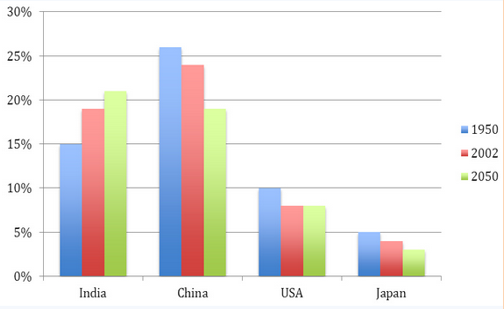
The bar chart compares the changes in the proportion of population in India, China, the USA and Japan in 1950 and 2002. And it also indicates the projections for 2050.
In 1950. China accounted for one fourth of the world population. Although this figure decreased slightly, it still ranked the first in 2002, compared to other three countries. It is estimated that the population in China will continue to drop to 19 per cent in the middle of this century.
India ranked the second in terms of the population in the table, which made up 15 percent in 1950, but since then, there was a dramatic increase, climbing to approximately 19 percent. The percentage is expected to increase slightly to 21 per cent in 2050 and will probably exceed that in China.
When it comes to the population in the USA and Japan, both of which witnessed a decrease from 1950 to 2002. It is predicted that in 2050, the percentage will remain the same in the USA, and in Japan, the percentage is likely to keep falling.
Overall, it seems that India will become the country with the largest population although there is still a huge number of people in China.
(202 words)


 沪公网安备
31010602002658号
沪公网安备
31010602002658号


