
9分雅思图表写作范文全集之混合图篇 温度与降水
问题相似?试试立即获取解答吧~
摘要:本文所列雅思混合图小作文范文,9分,4段式,173词,主题是线图+柱状图:温度与降水。大家如何学习文笔流畅,用词地道,言简意赅的考官级范文呢?先独立写作而后比照研习,方可提升。混合图是最考验数据归纳描述能力的题型,烤鸭们努力吧。
9分雅思图表小作文范文全集之混合图:温度与降水The climograph below shows average monthly temperatures and rainfall in the city of Kolkata.
真题传送门:2017全年雅思写作真题范文大汇总(第一时间更新)
范文:
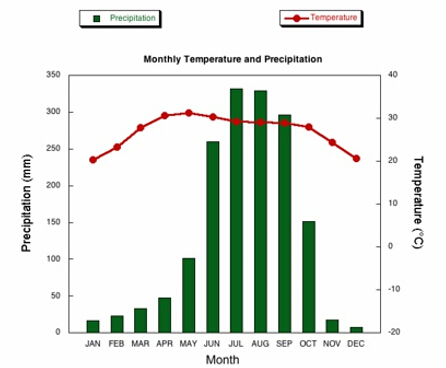
The chart compares average figures for temperature and precipitation over the course of a calendar year in Kolkata.
It is noticeable that monthly figures for precipitation in Kolkata vary considerably, whereas monthly temperatures remain relatively stable. Rainfall is highest from July to August, while temperatures are highest in April and May.
Between the months of January and May, average temperatures in Kolkata rise from their lowest point at around 20°C to a peak of just over 30°C. Average rainfall in the city also rises over the same period, from approximately 20mm of rain in January to 100mm in May.
While temperatures stay roughly the same for the next four months, the amount of rainfall more than doubles between May and June. Figures for precipitation remain above 250mm from June to September, peaking at around 330mm in July. The final three months of the year see a dramatic fall in precipitation, to a low of about 10mm in December, and a steady drop in temperatures back to the January average.(173 words, band 9)
本文内容来源网络,版权归原作者所有,如有侵权请立即与我们联系contactus#zhan.com,我们将及时处理。
 沪公网安备
31010602002658号
沪公网安备
31010602002658号

每日提分任务
专业提分资料
全程督学答疑


