
9分雅思图表写作范文全集之混合图篇 水消耗
问题相似?试试立即获取解答吧~
摘要:本文所列雅思混合图小作文范文,9分,3段式,184词,主题是线图+表格:水消耗。大家如何学习文笔流畅,用词地道,言简意赅的考官级范文呢?先独立写作而后比照研习,方可提升。混合图是最考验数据归纳描述能力的题型,烤鸭们努力吧。
9分雅思图表小作文范文全集之 混合图题型:水消耗The graph and table below give information about water use worldwide and water consumption in two different countries.
真题传送门:2017全年雅思写作真题范文大汇总(第一时间更新)
范文:
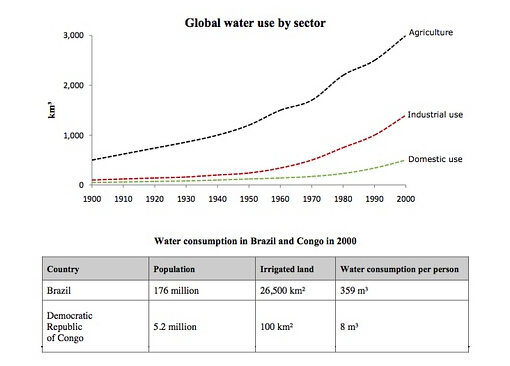
The charts compare the amount of water used for agriculture, industry and homes around the world, and water use in Brazil and the Democratic Republic of Congo.
It is clear that global water needs rose significantly between 1900 and 2000, and that agriculture accounted for the largest proportion of water used. We can also see that water consumption was considerably higher in Brazil than in the Congo.
In 1900, around 500km³ of water was used by the agriculture sector worldwide. The figures for industrial and domestic water consumption stood at around one fifth of that amount. By 2000, global water use for agriculture had increased to around 3000km³, industrial water use had risen to just under half that amount, and domestic consumption had reached approximately 500km³.
In the year 2000, the populations of Brazil and the Congo were 176 million and 5.2 million respectively. Water consumption per person in Brazil, at 359m³, was much higher than that in the Congo, at only 8m³, and this could be explained by the fact that Brazil had 265 times more irrigated land.(184 words, band 9)
本文内容来源网络,版权归原作者所有,如有侵权请立即与我们联系contactus#zhan.com,我们将及时处理。
 沪公网安备
31010602002658号
沪公网安备
31010602002658号

每日提分任务
专业提分资料
全程督学答疑


