
9分雅思图表小作文范文全集之流程图 天气预报
问题相似?试试立即获取解答吧~
摘要:本文所列雅思流程图小作文范文,9分,4段式,170词,主题是天气预报的出炉过程。大家如何学习文笔流畅,用词地道,言简意赅的考官级范文呢?先独立写作而后比照研习,方可提升。烤鸭们加油。
9分雅思范文之流程图 天气预报The diagram shows the process of weather forecast by Australian Bureau of Meteorology
真题传送门:2017全年雅思写作真题范文大汇总(第一时间更新)
范文
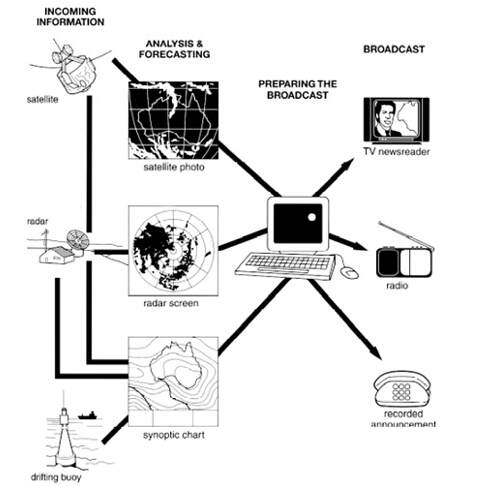
The figure illustrates the process used by the Australian Bureau of Meteorology to forecast the weather.
There are four stages in the process, beginning with the collection of information about the weather. This information is then analysed, prepared for presentation, and finally broadcast to the public.
Looking at the first and second stages of the process, there are three ways of collecting weather data and three ways of analysing it. Firstly, incoming information can be received by satellite and presented for analysis as a satellite photo. The same data can also be passed to a radar station and presented on a radar screen or synoptic chart. Secondly, incoming information may be collected directly by radar and analysed on a radar screen or synoptic chart. Finally, drifting buoys also receive data which can be shown on a synoptic chart.
At the third stage of the process, the weather broadcast is prepared on computers. Finally, it is delivered to the public on television, on the radio, or as a recorded telephone announcement.(170)
 沪公网安备
31010602002658号
沪公网安备
31010602002658号

每日提分任务
专业提分资料
全程督学答疑


