
[小站版]2017年5月6日雅思小作文真题范文:柱状图
问题相似?试试立即获取解答吧~
摘要:2017年05月06日雅思考试已经结束,小站教育教学研发中心高菀老师和朱琳老师为大家带来最新,最快,最全的考试回忆。小作文范文考察柱状图,范文由范钰红老师带来!
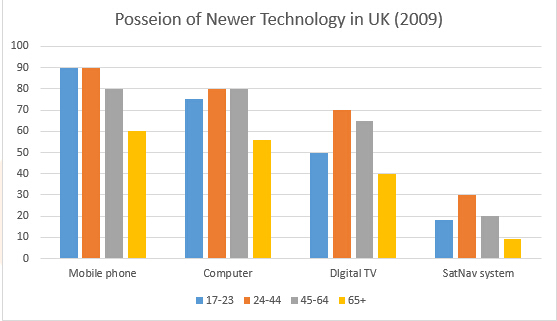
The chart below gives information about the possession of newer technologies by different age groups in UK in 2009.
Summarize important information, and make comparison and contrast.
解析:该柱图考题不管是柱子的数目还是横轴组别的内容都比较多。考生在处理此类图形时,务必选取合理的写作层次以及关注柱子之间的高低对比,尽可能替换语句表达和挑选重要特征描述。
The bar chart illustrates how many people of four different age groups possessed newer technologies in UK in 2009.
It can be seen that the same percentage of 17-23-year-olds and 24-44-year old people owned mobile phones, at 90%, while more people ( 80%) in latter age group had computers. In addition, the percentage of possession of digital TVs and SatNav system by people aged 24-44 was the highest compared with that for other people.
Referring to other two age groups, it was interesting to note that the figure for 45-64 years old people who possessed computers and mobile phones was equal at 80%. In terms of the other items of newer technologies, the percentage of their possession by this age group both ranked the second place. Obviously, the fewest oldest people had those technological products, with only 9% of them using SatNav system.
Overall, it was clear that most people in four age groups had mobile phones, however, SatNav system was least applied by them.
(165 words)原创来自小站范钰红老师


 沪公网安备
31010602002658号
沪公网安备
31010602002658号


