
【小站出品】2016年11月3日雅思考试小作文范文
问题相似?试试立即获取解答吧~
摘要:11月3日雅思写作考试真题小作文考的是柱状图题:1998年和2010年,成年人花在不同休闲活动的花费比例。我们来看小站老师的范文怎么说的。
Task:The chart below shows the percentage of time adults spending in different leisure activities in a particular country in 1998 and 2010.
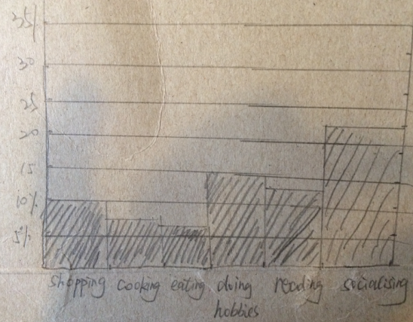
the percentage in 1998
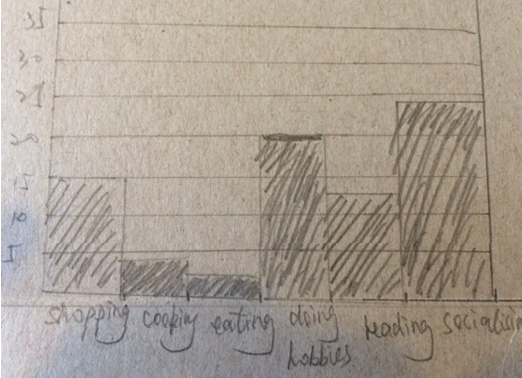
The percentage in 2010
Sample answer:
The charts compare the percentage of time adults spend in six areas including shopping, cooking, eating, developing hobbies, reading and socializing between 1998 and 2010.
Generally speaking, the overall trends were quite similar from 1998 and 2010, to be more accurate, more than 20% of their spare time had been used for building social connections, followed by developing their hobbies, reading and shopping as well. On the contrary, people spent limited time on cooking and eating, the percentage of which was less than 10 in 1998 and even 5 in 2010.
However, slight differences can also be observed. To be specific, the time spent on shopping, and developing hobbies had increased obviously, from 10% to 15% and from 15% to 20% respectively during that period of time. Meanwhile, a subtle increase can be seen regarding socializing. In addition to this, the percentage of time used for reading maintained steady. By contrast, compared with 1998, people spent less time on cooking and eating due to the change of lifestyle in that country.
(171 words)


 沪公网安备
31010602002658号
沪公网安备
31010602002658号


