
【小站出品】2016年10月29日雅思考试小作文范文
问题相似?试试立即获取解答吧~
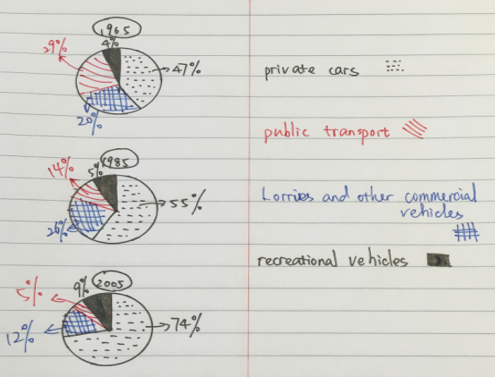
摘要:10月29日雅思写作考试真题小作文考得是饼状图题:在三个不同的年份,英国通过一个主要的公路桥的不同类型的车辆的比例。我们来看小站老师的范文怎么说的。
Task:The charts below show the proportions of different types of vehicles using a major road bridge in the UK in 1965, 1985 and 2005.
Sample answer:
The pie charts demonstrate the percentages of various kinds of vehicles utilizing a major road bridge in the United Kingdom in the year of 1965, 1985 and 2005.
Private cars and recreational vehicles relied more heavily on the road bridge. In 1965, only 47% private cars and 4% recreational vehicles made use of the bridge. The figure for private cars rose to 55% in 1985 and 74% in 2005 while that for recreational vehicles increased to 5% in 1985 and 9% in 2005.
On the contrary, public transport experienced an opposite trend and lorries and other commercial vehicles had a rather mixed picture. There was a steady decrease in public transport use of the bridge from 29% in 1965 to 5% in 2005. The proportions for lorries and other commercial vehicles taking advantage of the bridge eventually dropped to 12% in 2005 from 20% in 1965 after an initial increase to 26% in 1985.
In summary, private cars revealed the highest usage rate of the bridge, with recreational vehicles ranking last.
(171 words)


 沪公网安备
31010602002658号
沪公网安备
31010602002658号


