
【小站出品】2016年9月10日雅思考试小作文范文
问题相似?试试立即获取解答吧~
摘要:分享小站老师写的9月10日雅思写作的小作文参考范文。本次小作文考的是一道柱状图题:The charts blow shows the number of houses constructed in a particular place from 1999 to 2002.来看范文!
Task:The charts blow shows the number of houses constructed in a particular place from 1999 to 2002.
参考范文:
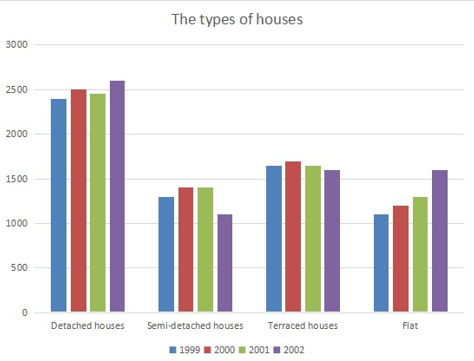
Given is a column graph comparing the number of four types of houses built in a place over the four years between 1999 and 2002.
It is fairly clear that detached houses in this area were the most the popular one, while the gross number of the rest of house types, during this period, can hardly surpass detached houses with over 2000 units for each year.
In 1999, 2400 units detached houses were constructed ,which was almost two times the average number of these two kinds: semi-conducted and flats with under 1500 units. At the same time, the terraced houses with 1600 units ranked the second place. In the following years, there was a constant growth in the number of flats. By contrast, terraced houses fell by 100 units and the figure of semi-detached houses, arriving at the same number 1400 units previously in 2000 and 2010, decreased to 1100 in 2002. Although the detached houses experienced a minor decline from 2500 in 2000 to 2450 in 2001, it finally achieved 2600 units in 2002.
(175 words)


 沪公网安备
31010602002658号
沪公网安备
31010602002658号


