
【小站出品】2016年9月3日雅思考试小作文范文
问题相似?试试立即获取解答吧~
摘要:分享小站老师写的9月3日雅思写作的小作文参考范文。本次小作文考的是一道表格题:The table below shows the population changes from 1950 to 2000,and the prediction of population in 2050.来看范文!
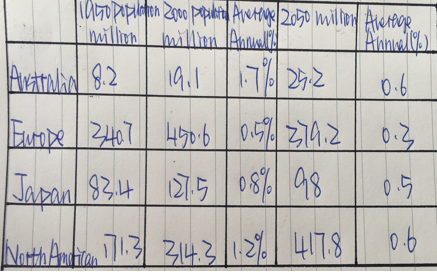
Task:The table below shows the population changes from 1950 to 2000,and the prediction of population in 2050.
参考范文:
The sheet reveals how the population of Australia, Europe, Japan and North America altered between 1950 and 2000 and the projection in the year 2050.
Obviously, Europe and North America have a huge population. From 1950 to 2000, the population of Europe increased from 340.4 to 450.6 million while the figure for North America rose from 171.3 to 314.3 million, with the former experiencing an average annual rise of 0.5% whereas the later 1.2%. In 2050, it is predicted that Europe will have a growth rate of 0.3% annually and a population of 379.2 million. By contrast, North America will witness a faster increase rate of 0.6% each year and a population of 417.8 million in the middle of the twenty first century.
In comparison, Japan and Australia seem to have fewer people. The period from 1950 to 2000 witnessed Japan’s population growth at 0.8% yearly from 83.4 to 127.5 million, and that of Australia at 1.7% per annum from 8.2 to 19.1 million. Up to 2050, populations of both regions are projected to slow down at a growth rate of about 0.55% annually with that of Japan arriving at 98 million and that of Australia reaching 25.2 million.
In sum, although there was and will be a larger population in the four areas in question, fortunately the average growth rates for all of them will slow down.
(228 words)


 沪公网安备
31010602002658号
沪公网安备
31010602002658号


