
雅思写作Task1小作文线性图范文--中国和美国的出生率变化
问题相似?试试立即获取解答吧~
摘要:小站雅思频道这里和大家分享小作文线性图的一篇范文,关于中国和美国的出生率变化,真题是:Price in US dollars of a barrel of oil from 1995 to 2015.来看关于这个task的解析和范文!
Task:The changes in the birth rates of China and the USA between 1920 and 2000.
思路分析:
1. 两条线,建议每条线一段;
2. 每条线的描述请参考经典折线写法(在数据库里有,详见《单线 指导写法》);
3. 关键性数据不可少,如最大值,最小值等;
参考范文:
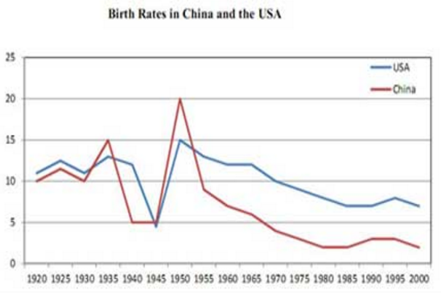
The graph demonstrated some striking similarities between the Chinese and the US birth rates from 1920 to 2000.
The birth rates in China rose from 10% in 1920 to 15% in 1935. Later, the figure plunged to a low of 5% in the 1940s and was followed by an exponential growth to the peak of 20% in 1950. Next, the fertility rate dropped sharply to 8% in the following five years. Finally, the figure declined gradually to 3% during the latter half of the century.
Meanwhile, the US had similar birth rate of 12% to that of China in 1920. The figure fluctuated in between 12% and 14% during 1920s and 1930s until it hit a low of 4% in 1945. Five years later, the birth rate reached a peak at 15% in 1950 but it made a steady fall to the final figure of around 7% in 2000.
Overall, both countries experienced considerable fluctuations in the similar period with some lows during the 1940s and some highs during the 1930s.
(171 words)


 沪公网安备
31010602002658号
沪公网安备
31010602002658号


