雅思写作Task1小作文饼状图范文--多饼图(1)
问题相似?试试立即获取解答吧~
摘要:小站雅思频道这里和大家分享小作文饼状图的范文,真题是:Write a report for a university lecturer describing the information in the two graphs below.
Task:Write a report for a university lecturer describing the information in the two graphs below.
参考范文:
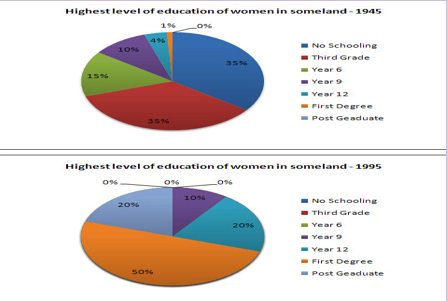
The pie charts compare the highest level of education achieved by women in Someland across two years, 1945 and 1995. It can be clearly seen that women received a much higher level of education in Someland in 1995 than they did in 1945.
In 1945 only 30% of women completed their secondary education and 1% went on to a first degree. No women had completed post-graduate studies. This situation had changed radically by 1995. In 1995, 90% of women in Someland had completed secondary education and of those, half had graduated from an initial degree and 20% had gone on to postgraduate studies. At the other end of the scale we can see that by 1995 all girls were completing lower secondary, although 10% ended their schooling at this point. This is in stark contrast with 1945 when only 30% of girls completed primary school, 35% had no schooling at all and 35% only completed the third grade.
In conclusion, we can see that in the 50 years from 1945 to 1995 there have been huge positive developments to the education levels of women in Someland.(186)


 沪公网安备
31010602002658号
沪公网安备
31010602002658号